Sensitivity analysis on a model
Contents
Sensitivity analysis on a model#
This tutorial shows how to use DataFusionTools to perform sensitivity analysis on a model.
First it is necessary to import the datafusion tools packages:
import numpy as np
import matplotlib.pylab as plt
from datafusiontools.sensitivity.sensitivity import Sensitivity, SensitivityMethods
Available methods#
There are to methods available to perform the sensitivity analysis:
Application#
To illustrate the use of the methods the Sellmeijer piping model is used. The Sellmeijer piping model can be imported from:
from tests.models.piping import SellmeijerRule
To run the Sellmeijer model:
hc = SellmeijerRule.calculate_critical_head([50, 20, 1e-3, 2e-4, 2650, 1000, 2.50E-01, 37])
where the arguments are:
L
D
kappa
d70
rho_s
rho_l
eta
theta
Sensitivity analysis#
In order to perform a sensitivity analysis it is necessary to define the variables which will be tested, and their ranges. These need to be defined as a dictionary:
param_piping = {"names": ["L", "D", "kappa", "d70", "rho_s", "rho_l", "eta", "theta"],
                "bounds": [[5, 20], [10, 100], [1e-10, 1e-2], [2e-7, 2e-4], [2000, 3000], [900, 1100], [2.5E-2, 2.5], [30, 50]],
                }
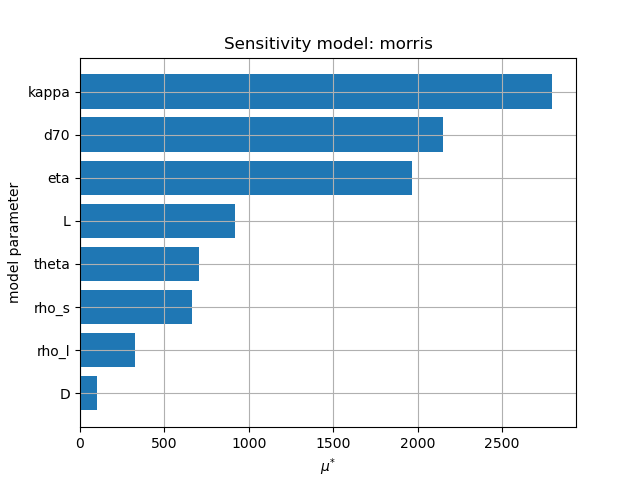
Morris method#
To perform the sensitivity analysis with the Morris method:
s = Sensitivity()
s.define_model(SellmeijerRule.calculate_critical_head, param_piping)
s.run_sensitivity(SensitivityMethods.Morris)
s.plot("sensitivity", "Morris.png")
This will create a figure Morris.png on the sensitivity folder.
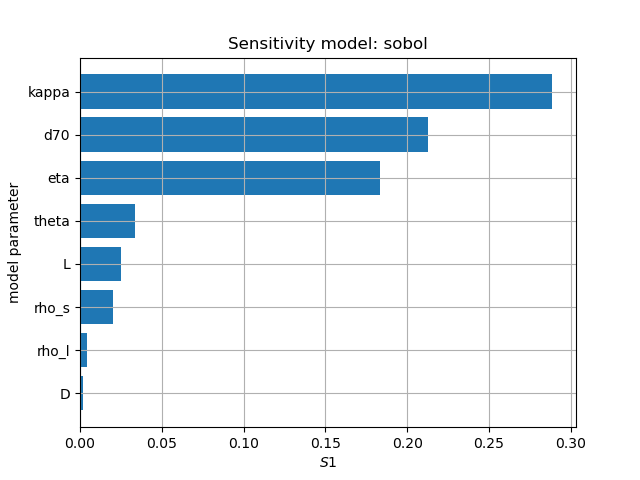
Sobol method#
To perform the sensitivity analysis with the Sobol method:
s = Sensitivity()
s.define_model(SellmeijerRule.calculate_critical_head, param_piping)
s.run_sensitivity(SensitivityMethods.Sobol)
s.plot("sensitivity", "Sobol.png")
This will create a figure Sobol.png on the sensitivity folder.
Other uses#
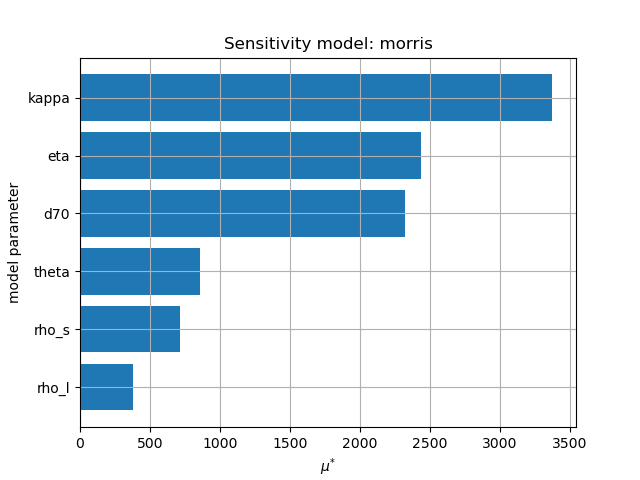
The sensitivity analysis can also be run with models in which there are fixed variables. For example, for the Sellmeijer model it can be assumed that L and D are constants, and that the sensitivity study is to be performed on the remaining variables.
param_piping = {"names": ["kappa", "d70", "rho_s", "rho_l", "eta", "theta"],
                "bounds": [[1e-10, 1e-2], [2e-7, 2e-4], [2000, 3000], [900, 1100], [2.5E-2, 2.5], [30, 50]],
                }
L = 20
D = 50
The fixed variables should be passed in de model definition as last arguments.
s = Sensitivity()
s.define_model(SellmeijerRule.calculate_critical_head, param_piping, L, D)
s.run_sensitivity(SensitivityMethods.Morris)
s.plot("sensitivity", "Morris_less.png")
Again the results can be visualised. If follows that now no sensitivity is shown for L and D.